From Vibe Coder to Solution Architect
GIS & Data Specialist with 4+ years of experience managing large-scale spatial and tabular datasets across complex, multi-source projects. Currently designing and deploying production-ready AI and automation tools at Chronicle — including fuzzy matching pipelines, automated QA validators, and AI-integrated data workflows processing tens of thousands of records.
On a journey from vibe coder → developer → AI & Automation Solution Architect. Focused on deeply understanding software architecture patterns and automation systems — not just finding quick fixes, but understanding why an approach is chosen. Strong foundation in land use mapping and spatial data management, with hands-on experience in AI API integration and modern data tooling.
Career Journey
Nov 2025 — Present
AI/Automation R&D Specialist @ Chronicle Cemetery Software
- 13 production-ready automation & AI tools in 5 months, reducing data pipeline bottlenecks
- Automated multi-source fuzzy matching & merging pipeline (thousands to tens of thousands of rows)
- AI-powered Auto QC system (Data Integrity & Format Validator) for pre-upload validation
- Integrated AI APIs & Agent CLI into production (Headstone Transcribe, Document Categorizer, etc.)
Aug 2024 — Oct 2025
GIS Project & Support Team Lead @ Chronicle Cemetery Software
- Oversaw end-to-end GIS delivery for 3 new clients/month, 99% QC accuracy
- Redesigned GIS workflows — improved team efficiency by 30% without compromising quality
- 2 Python automation scripts/month replacing manual, repeatable tasks
Oct 2022 — Sep 2024
GIS Support Specialist → GIS Analyst @ Chronicle Cemetery Software
- Converted multi-format legacy data (CAD, Excel, Access, drone imagery) into structured GIS databases
- Processed drone imagery (Agisoft Photoscan, Pix4D) into high-resolution orthomosaics
Earlier Roles
- Urban Planner Expert Assistant — DPU PR Kab. Natuna (1:5,000 RDTR mapping, ArcGIS + SPOT 6 imagery)
- Land Surveyor & Data Entry — Bantul Land & Spatial Planning Office (field survey & land registry)
- Staff Intern & Practicum Assistant — Bappeda Sleman & UGM Remote Sensing & GIS Diploma
🎓 Diploma III in Remote Sensing & GIS, Universitas Gadjah Mada — Yogyakarta
Selected Work
Case studies of ongoing & completed projects. This list keeps growing.
Kalimantan Wildfire Mapping & Analysis
End-to-end remote sensing pipeline: from raw satellite data to visualization & quantitative validation based on ASEAN/CIFOR standards.
Next Project
This slot is waiting for the next case study — will be added as new projects wrap up.
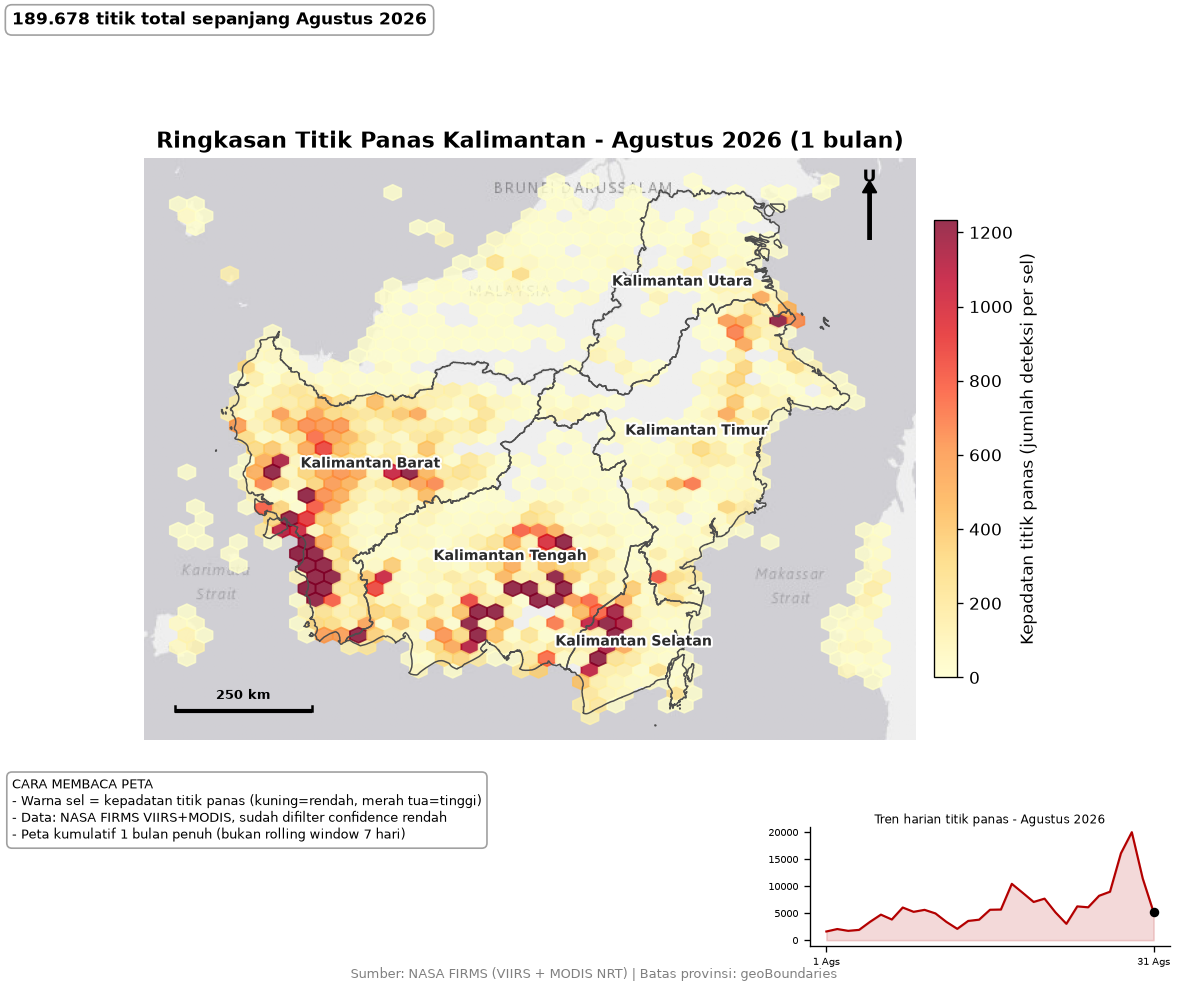
Kalimantan Wildfire Mapping & Analysis
End-to-end remote sensing pipeline: from raw satellite data to publication-ready visualization & quantitative validation based on ASEAN/CIFOR standards.
(August 2026)
(≥2 satellite sensors)
compared (2015/2019/2026)
(dNBR, 3 sample sites)
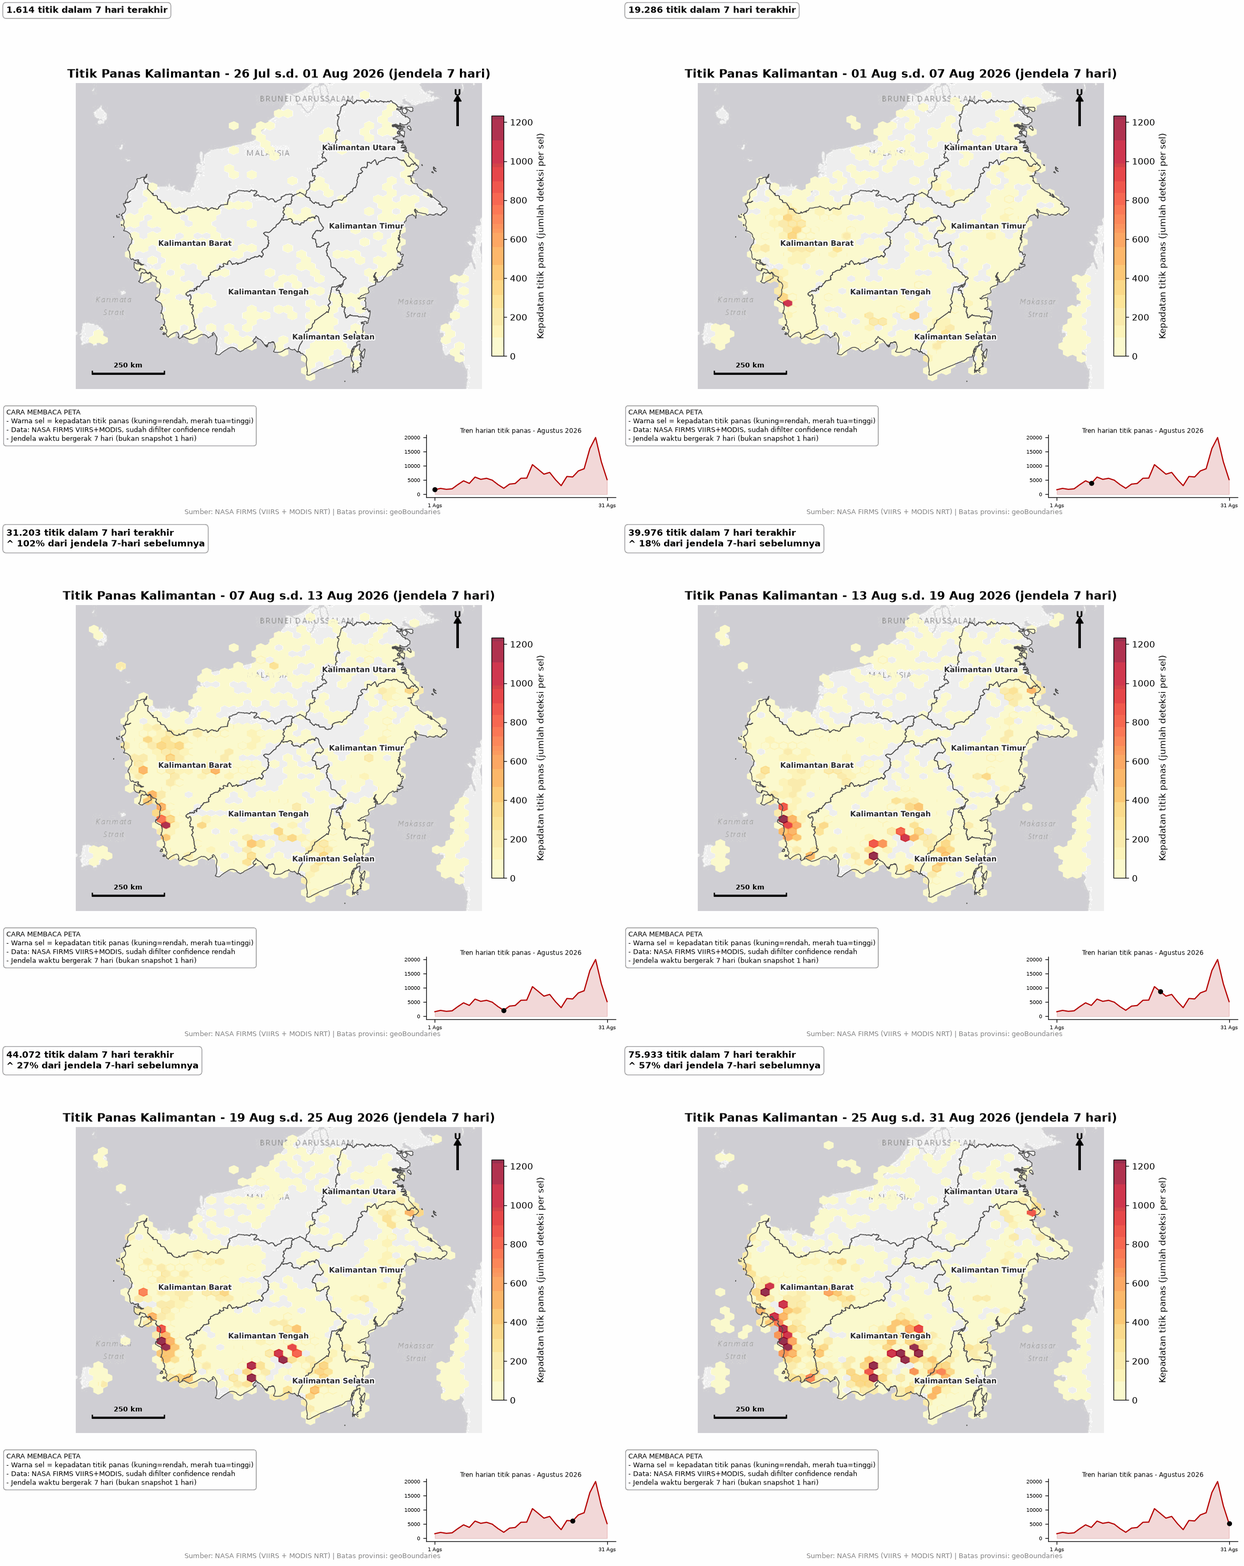
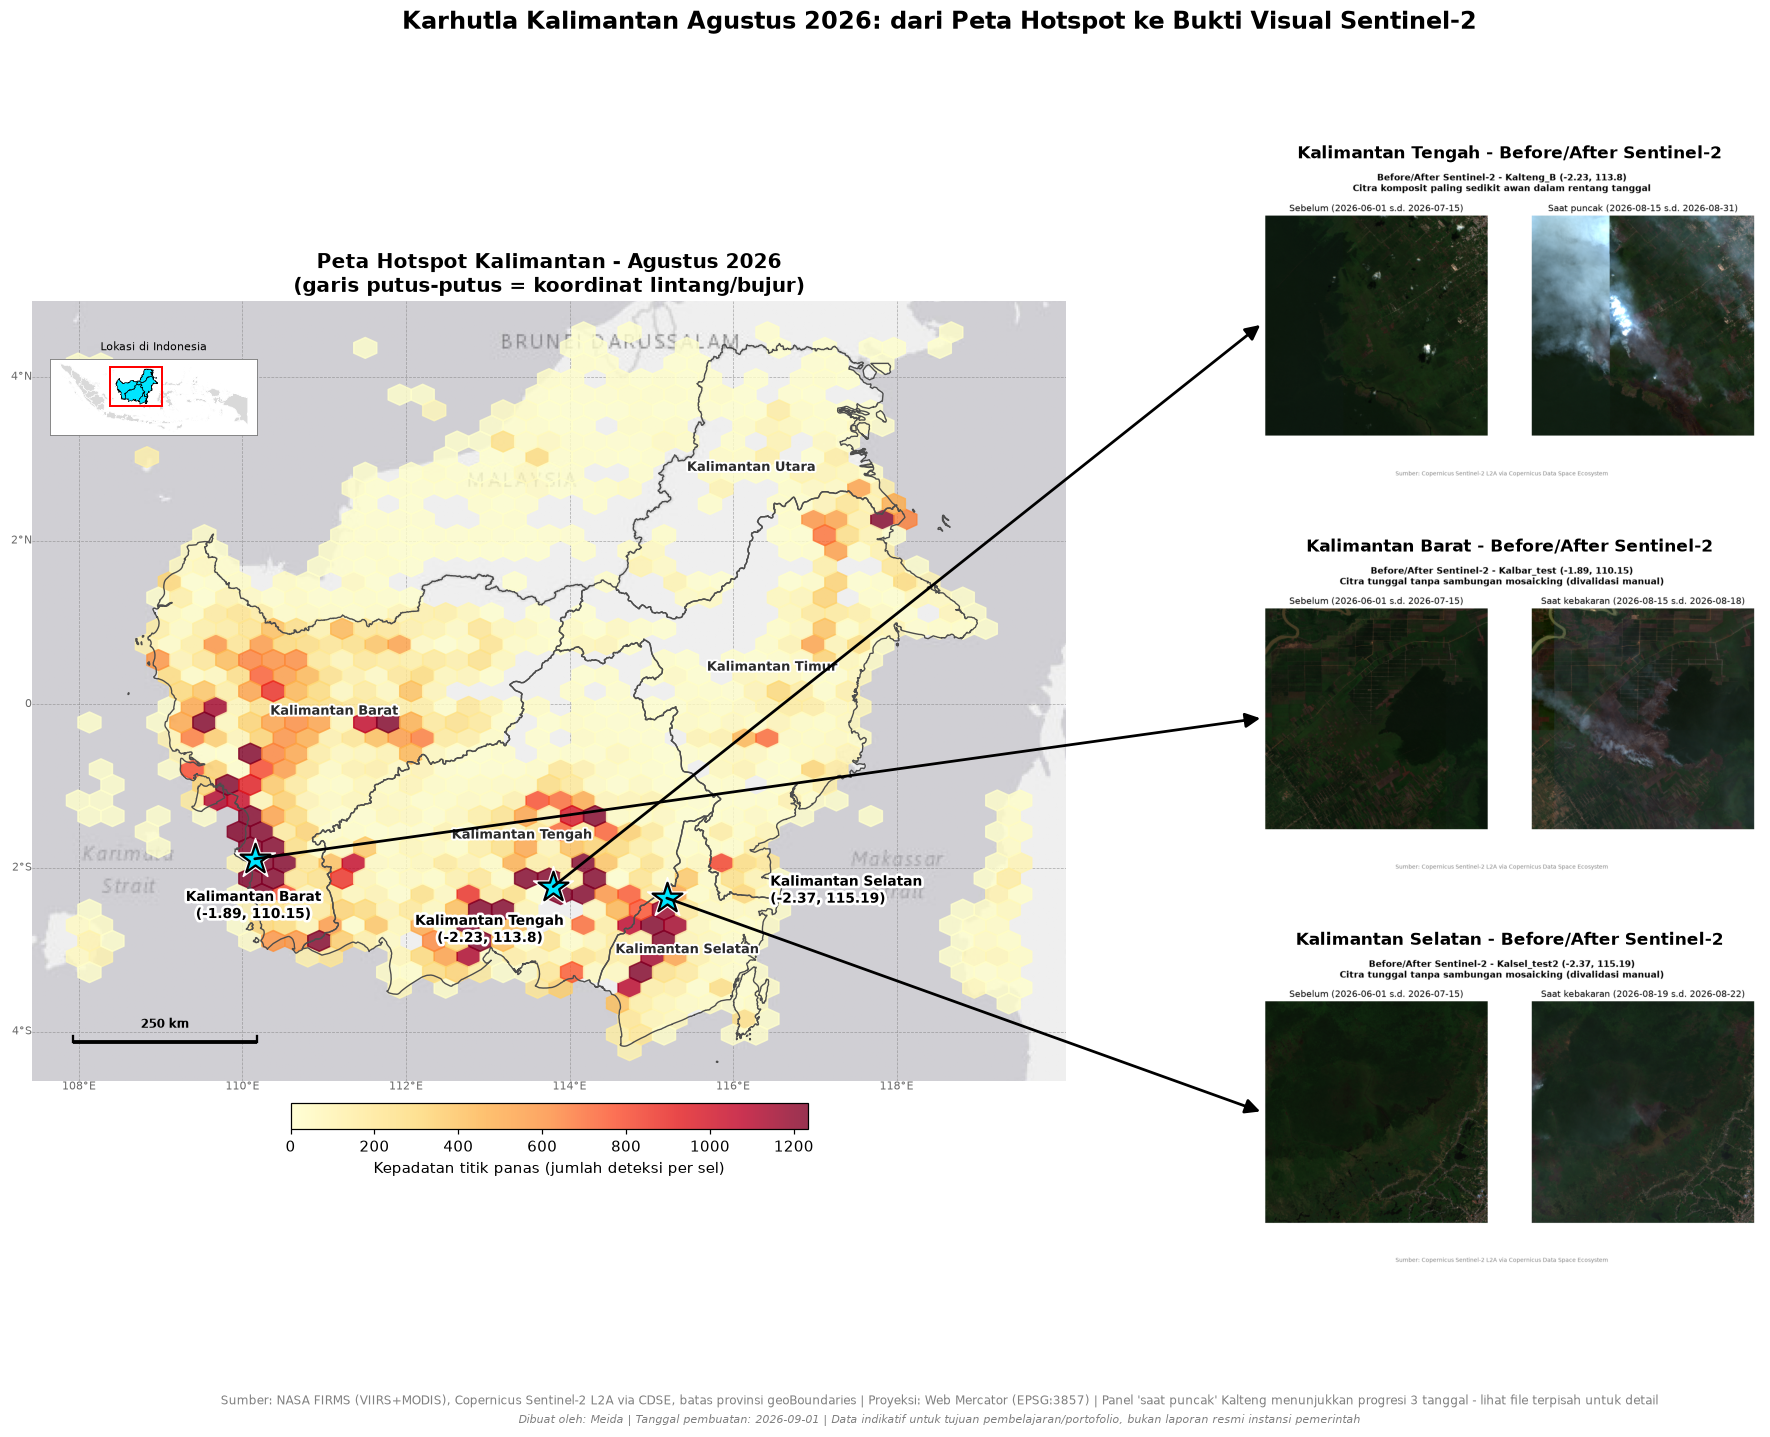
Hotspot Timelapse — August 2026
NASA FIRMS data (VIIRS + MODIS), filtered by confidence level, cross-validated between sensors via spatial buffer analysis (not just coordinate rounding). 7-day rolling-window visualization follows Copernicus EMS/EFFIS (Europe) & Sentinel Asia/ASMC (Asia) cartographic standards.
- Confidence filtering + cross-sensor dedupe
- Scale bar, north arrow, province boundaries, legend
- ColorBrewer YlOrRd color scheme (research-validated, colorblind-safe)
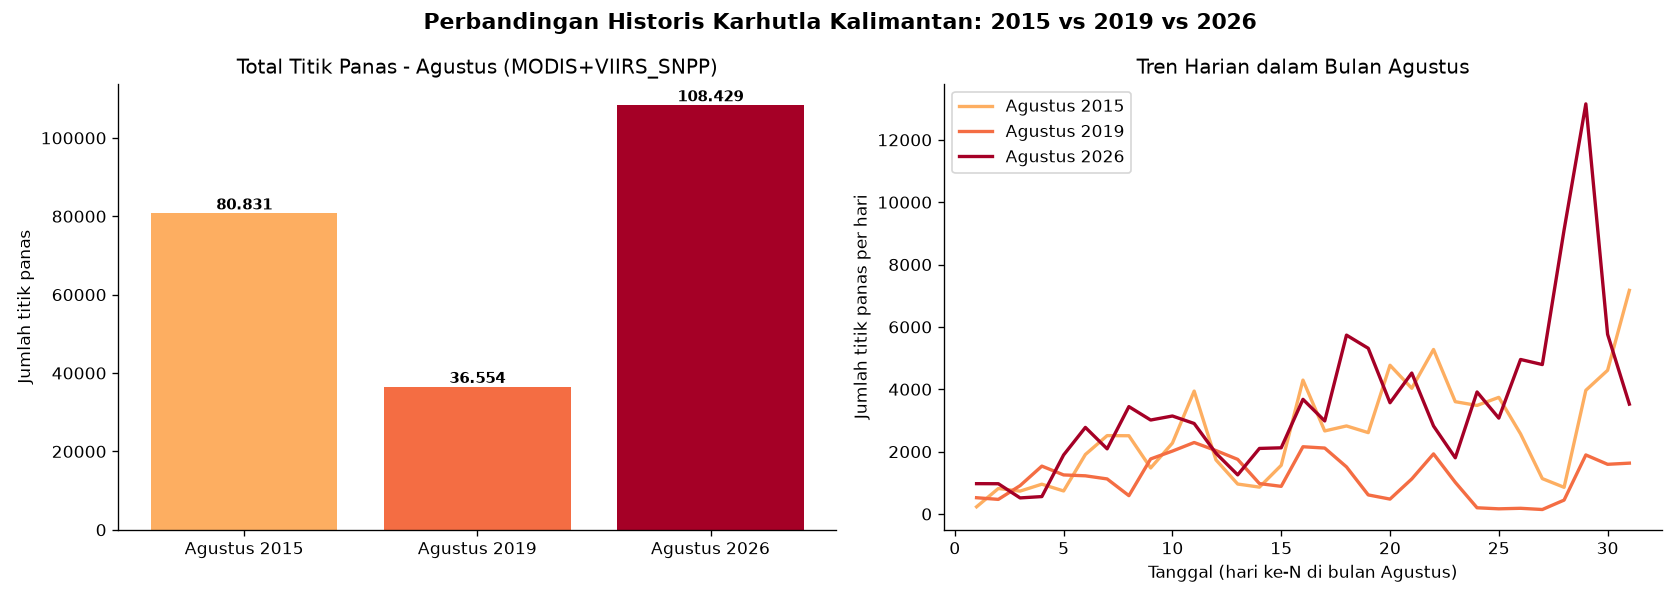
Historical Comparison: 2015 vs 2019 vs 2026
Is this wildfire crisis a recurring pattern? Compared using the same sensor combination (MODIS + VIIRS_SNPP) across all three periods for a fair comparison — NOAA-20 has only been available since 2017/2018, so it was excluded from the historical analysis.
- August 2026: 108,429 hotspots — the highest of the 3 periods
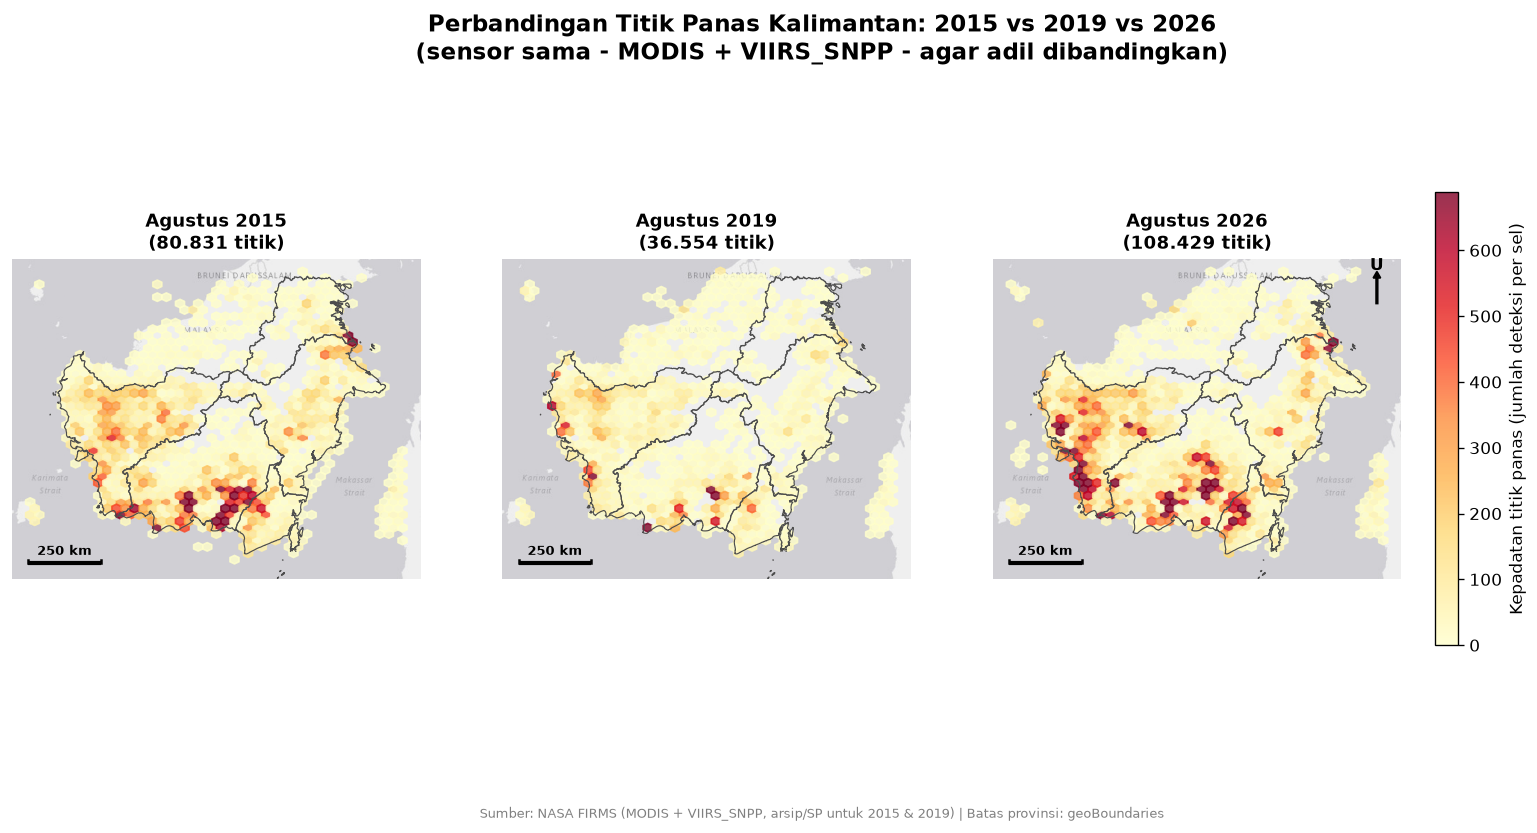
- Geographic cluster pattern consistently recurs every year
- FIRMS Standard Processing archive data for 2015/2019
3 Side-by-Side Maps, Same Color Scale
Small-multiples to see whether the worst fire clusters appear in the same geographic location every year — indicating a recurring risk area (likely linked to peatland).
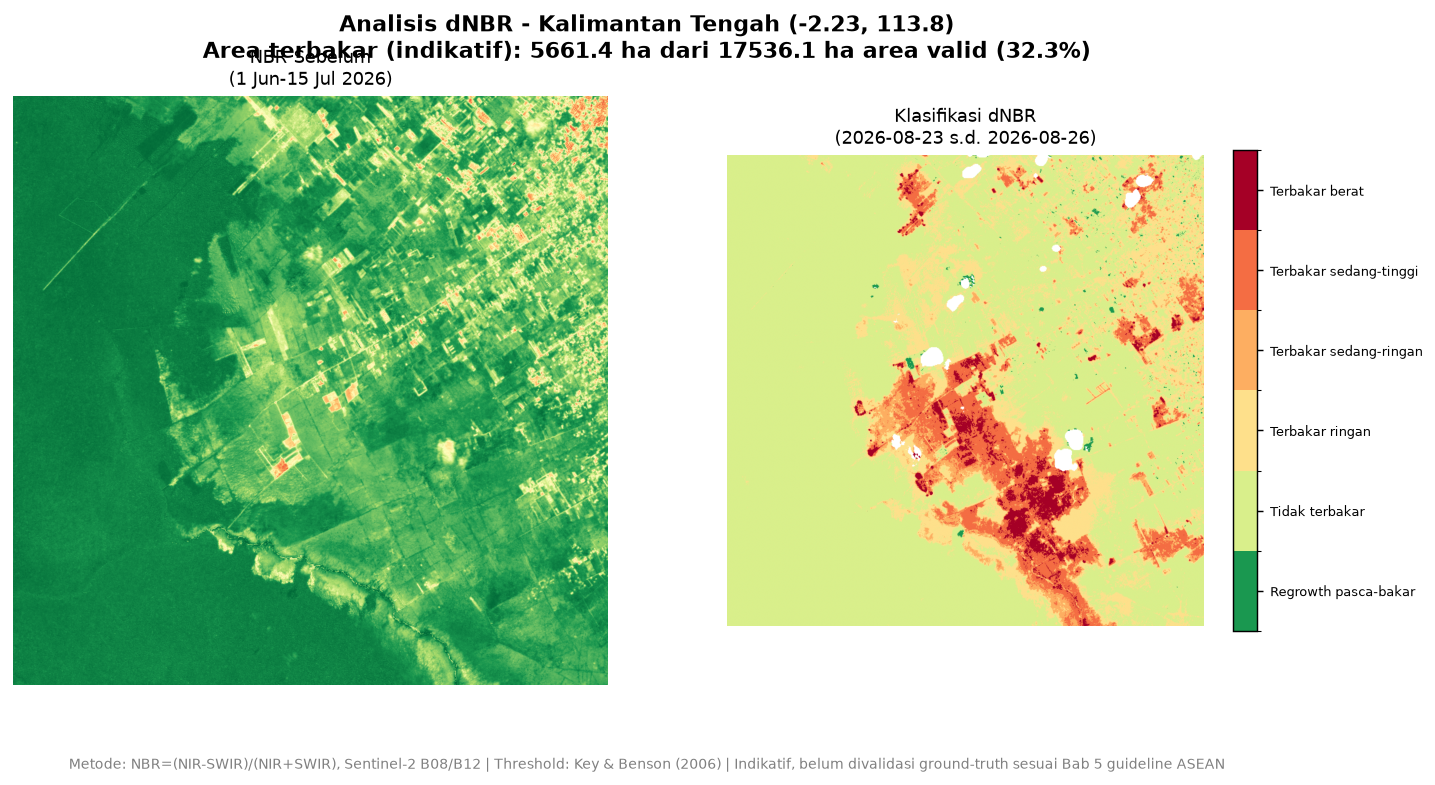
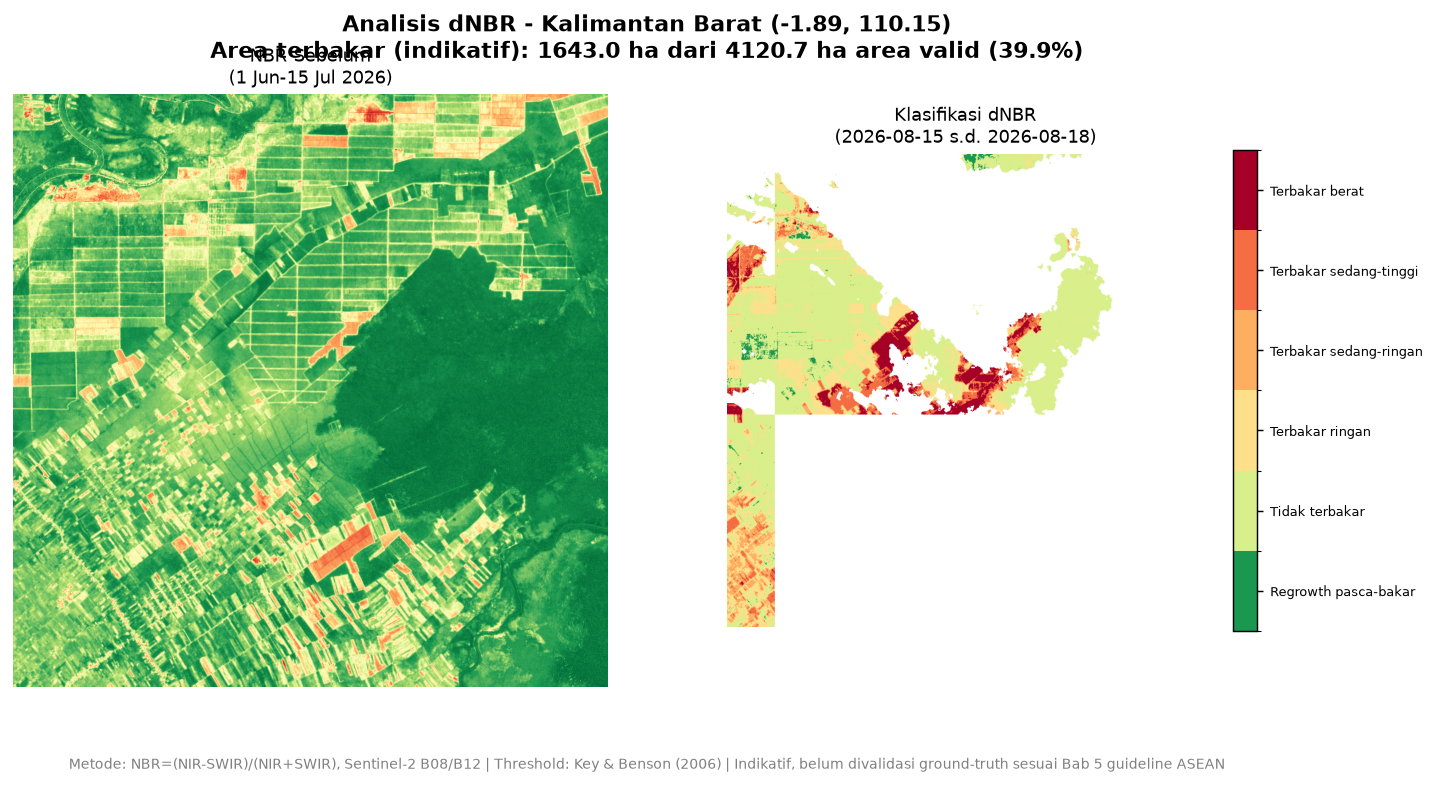
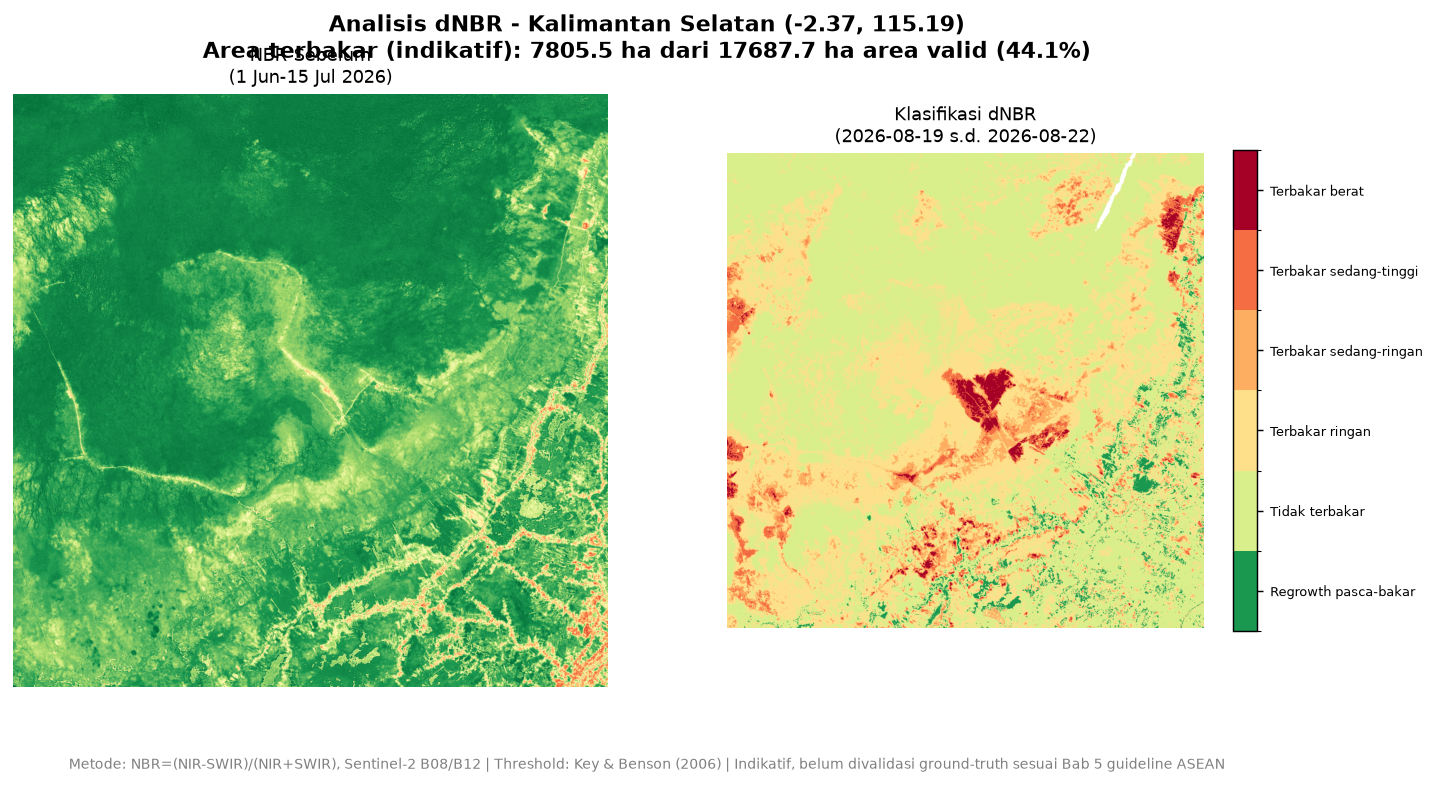
Visual Validation: Sentinel-2 & dNBR
Hotspots alone aren't enough — some turned out to be false positives from mining sites, not vegetation fires. Validated with 10m-resolution Sentinel-2 optical imagery and calculated dNBR (delta Normalized Burn Ratio) following the official Guideline on Burned Area Mapping and Estimation in Southeast Asia (ASEAN Secretariat & CIFOR, 2025).
- NBR = (NIR − SWIR) / (NIR + SWIR), Sentinel-2 bands B08/B12
- Severity classification + burned area estimate (hectares)
- Cross-checked against official BNPB/BPBD data — consistent scale
⚠ Data is indicative, for learning/portfolio purposes — not an official government report. Sources: NASA FIRMS, Copernicus Sentinel-2 (via Copernicus Data Space Ecosystem), geoBoundaries. dNBR thresholds follow Key & Benson (2006), not yet fully ground-truth validated per Chapter 5 of the ASEAN guideline.
← Back to project listTools & Methodology
GIS
QGIS, ArcGIS, GeoPandas, Shapely, spatial analysis, cartographic standards (EFFIS/ASMC)
Remote Sensing
NASA FIRMS, Copernicus Sentinel-2, dNBR, Agisoft Photoscan, Pix4D, cross-sensor validation
Data & Python
pandas, geopandas, matplotlib, scipy, SQL, ETL & data pipeline, data QA/QC
AI & Automation
Claude Code, Gemini CLI, AI API integration, fuzzy matching, automated workflow design
Let's Connect
Open to discussing GIS, remote sensing, AI automation, or project collaboration.
meidaistiqomah05@gmail.com